In his latest video update on YouTube, renowned cryptocurrency analyst Rekt Capital delved into the complicated dynamics surrounding the Bitcoin halving, presenting a compelling argument as to why the market has not yet priced in the April 19 halving. Based on historical data and patterns, Rekt Capital presented an in-depth analysis of the cyclical nature of Bitcoin price movements after the halving, suggesting that there are still significant phases of growth ahead.
Why Bitcoin halving is not priced
Rekt Capital began by revisiting the historical impact of Bitcoin halvings, which occur roughly every four years and halve the block reward received by miners. This reduction in supply, if demand remains constant or increases, usually leads to significant price increases. “Bitcoin halfving is not included in the price,” Rekt Capital said, pointing out that each previous halving led to a rally that not only reached but also exceeded previous all-time highs.
“Halfving every four years always precedes a fantastic rally in Bitcoin price action towards new all-time highs,” he noted. This consistent pattern creates a compelling narrative that post-halving market dynamics are somewhat predictable, yet complicated enough to remain partially unpredictable by the market. “There remain two phases in the cycle: the post-halving re-accumulation phase (red) and the parabolic rally phase (green),” he said.
Focusing on the re-accumulation phase that traditionally follows each halving, Rekt Capital highlighted that this phase typically lasts around 160 days. During this period, the market often sees price consolidation before a breakout leads to a parabolic rally. “We are currently in a period of reaccumulation again in this cycle. This is re-accumulation after halving,” he said, emphasizing the importance of this phase in preparing the ground for another bull run.
The analyst detailed the nature of these cycles, noting deviations in current trends compared to past cycles. “This cycle shows an accelerated pace, with new all-time highs occurring 260 days before the halving, which is a first in Bitcoin history,” he explained. Such deviations suggest that while historical patterns provide a blueprint for action, each cycle can introduce fresh dynamics that influence market behavior.
Rekt Capital did not overlook potential risks and possible market corrections. He cautioned against the initial rejection often seen after reaching a high price range following a halving, a trend seen in previous cycles. “Every time we saw an initial attempt to reach the high resistance range after the halving, that first attempt after the halving ended in failure,” he explained. This observation is crucial for investors expecting immediate profits after the halving, as it tempers overly confident expectations with a realistic view of possible short-term retracements.
The analyst also addressed the issue of decreasing returns in subsequent cycles, a factor closely monitored by experienced Bitcoin investors. Although in the past the peak of each cycle was higher than the previous one, the rate of growth has slowed. “If this were a one-for-one extension to what we saw in the previous cycle, it might be unrealistic to get us to $250,000 this time, and we would probably expect more subdued growth,” he predicted.
Nevertheless, Rekt Capital maintained a long-term confident outlook, suggesting that while the explosive growth momentum of early cycles may not be repeated, Bitcoin’s overall post-halving price upward trajectory remains intact. “This will be the most parabolic phase of the cycle, where we see profits coming very quickly in a short period of time,” he concluded, confirming the significant opportunities that lie ahead for Bitcoin investors.
At the time of publication, the BTC price was $68,561.
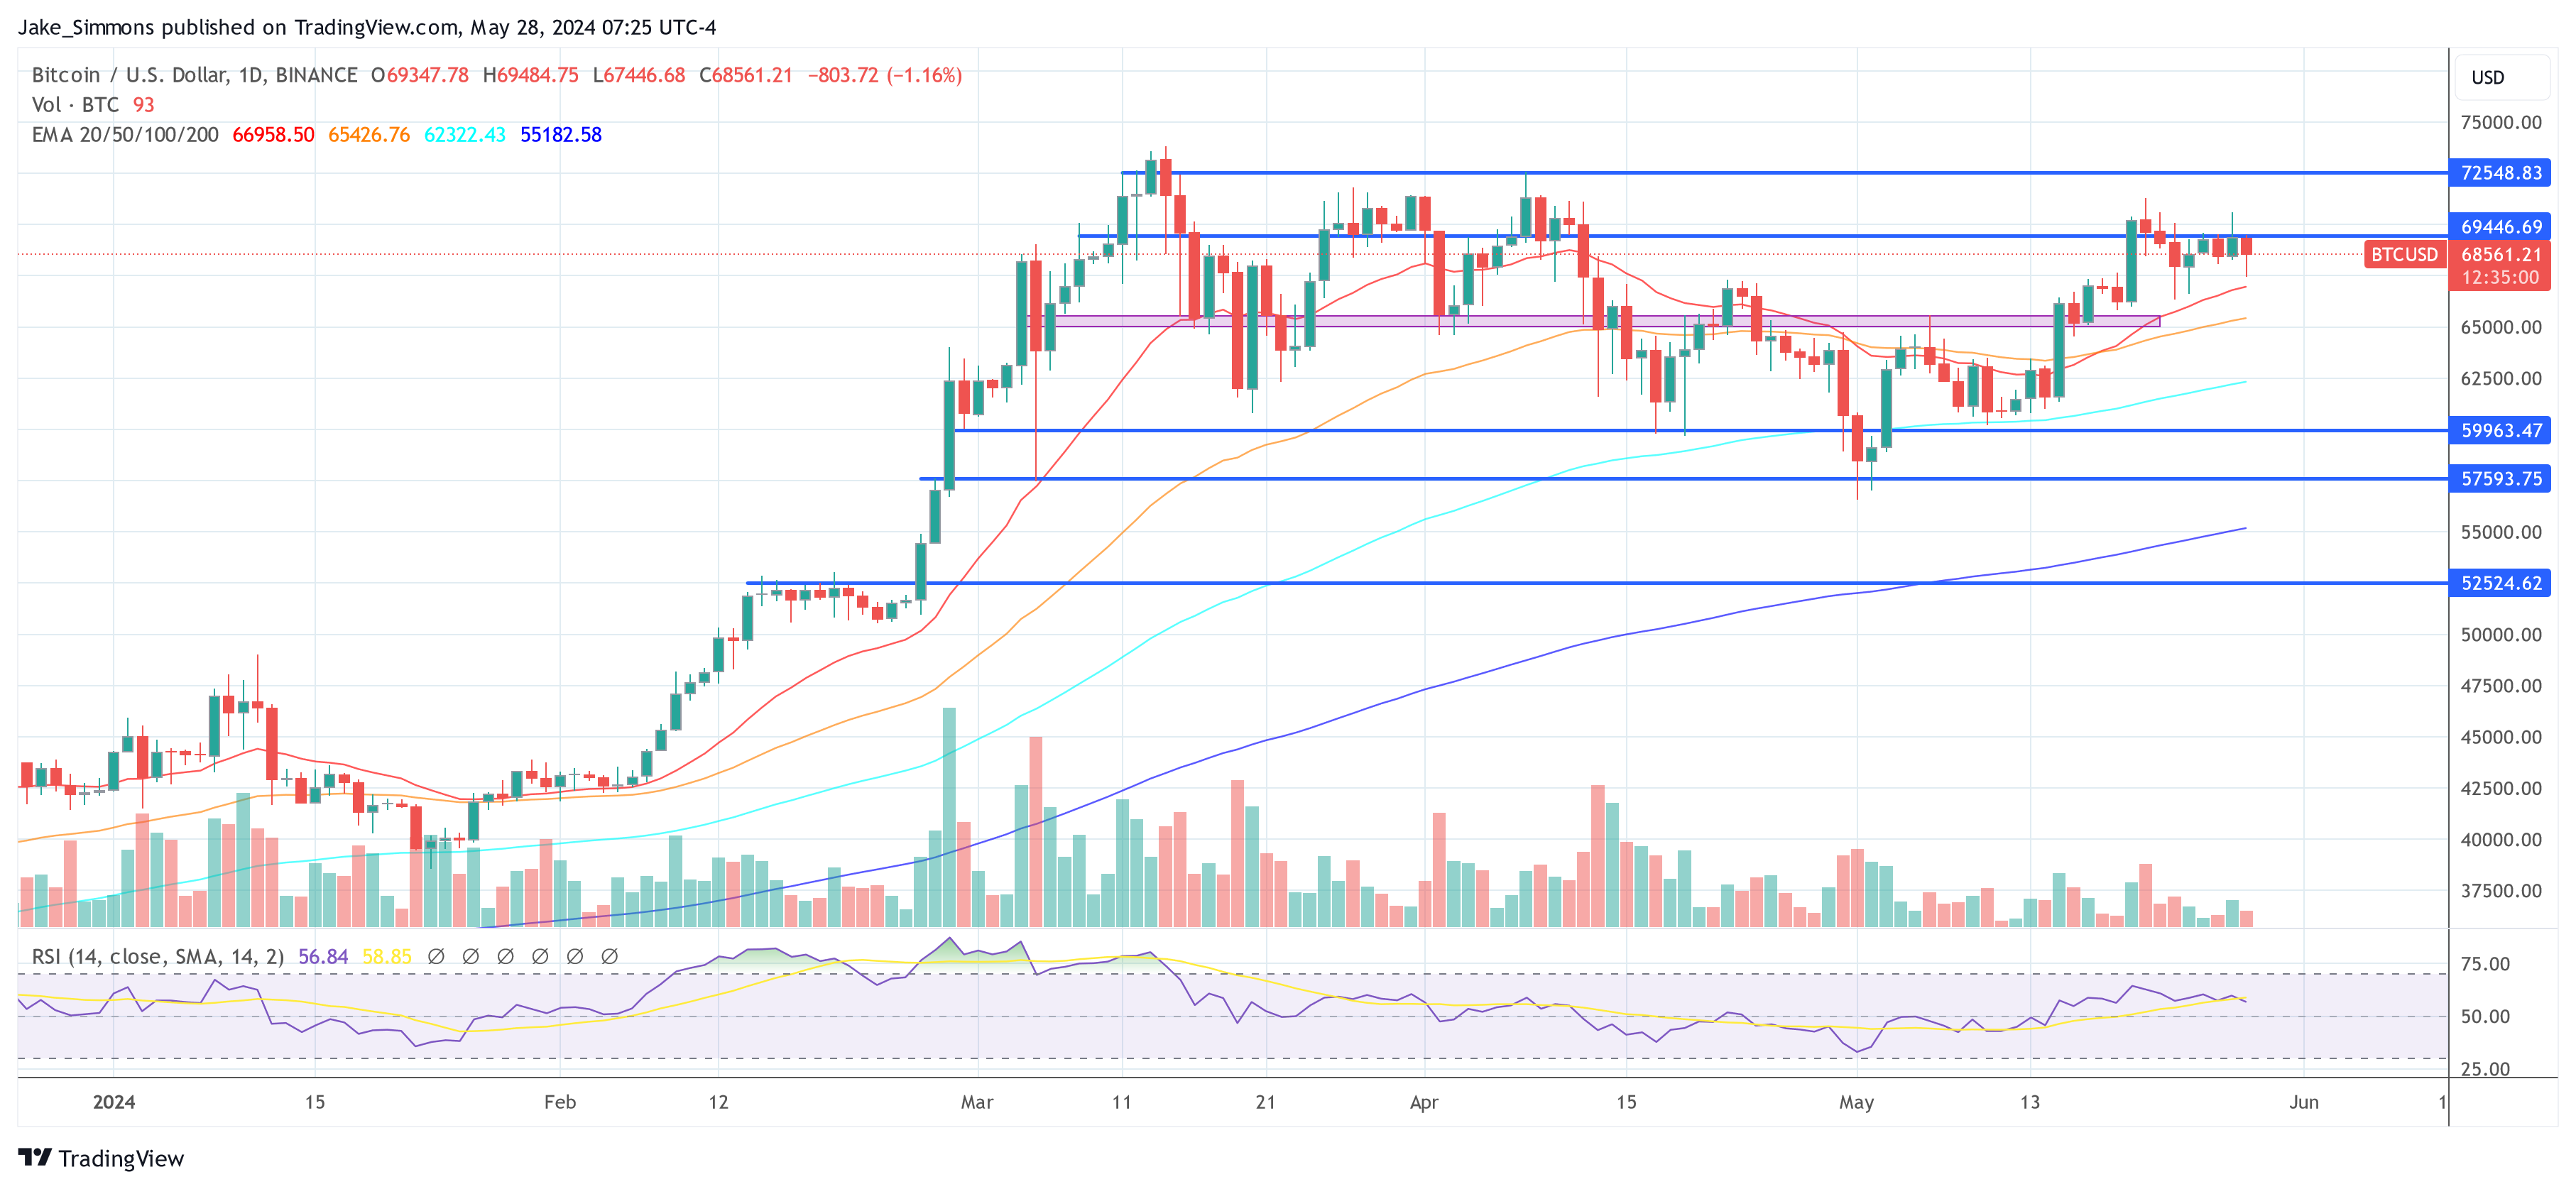
Featured image created with DALL·E, chart from TradingView.com