Solana’s price has surged over 33% in the past two weeks, and according to cryptocurrency analyst Ali Martinez (@ali_charts), this could be the precursor to a much larger rally. On the weekly chart (SOL/USD), Solana’s price is showing a major bullish pattern, suggesting a potential rally above $1,400.
Is Solana’s next chance $1,400?
Martinez illuminated a “bull flag” formation, a classic continuation pattern in technical analysis that could signal a significant upward move in Solana’s value in the coming months. “Nobody’s talking about the bull flag!” commented Martinez.
The chart shows a bull flag pattern, identified by a edged uptrend followed by a consolidating downtrend channel. This pattern began forming after a powerful price rally since mid-September last year, when Solana rose from around $17.50 to a peak of around $210. Following this rally, the price began to consolidate, forming a descending channel that suggests a period of accumulation and potential buyer exhaustion after the initial rally.
The flagpole, an vital element of the bull flag pattern, is established by the initial edged price boost, while the flag itself is represented by the later consolidation phase. This phase is represented by a series of higher lows and lower highs, converging at a narrowing point that suggests decreasing volatility and tightening price ranges — a typical precursor to a potential price breakout.
According to Martinez’s analysis, Solana’s price is $157.98, which is just below the upper trendline of the channel. Consolidation has formed in a narrow range, and the upper and lower boundaries are clearly marked by trendlines converging towards the point on the chart that is about to appear. The critical support level, observed in the consolidation phase, is located near the $130 level, and the resistance level is slightly above the current price, around $160.
If the bull flag pattern is true with respect to typical implications, a breakout can be expected at the top of converging trendlines. Historically, the anticipated breakout target of a bull flag is estimated by measuring the length of the flag pole – over 1000% in the case of SOL – and projecting up from the breakout point or from a support level (in a more conservative alternative).
According to Martinez’s chart, such a calculation would place Solana’s potential price target above $1,400. In a more conservative scenario, Solana could reach at least $1,300.
Key Resistance Levels for SOL
There are several resistances and intermediate price targets to overcome on the way to the massive price target. The most essential one in the tiny term is the .618 Fibonacci retracement level at $163. Known as the “golden ratio,” this is the most watched resistance at the moment.
Next, watch the 0.786 Fibonacci level at $205 as the last major resistance before the price revisits the November 2021 all-time high of around $260.
Fibonacci extension levels further offer potential targets if Solana price breaks above its initial high. The 161.8% extension at $415.23 represents a significant target for an initial price discovery.
The next levels, such as the 261.8% extension at $666 and the 361.8% level at $918, are key in a very powerful trend where the price is well outside the initial range. Interestingly, even the 423.6% extension only predicts the Solana price to rise to $1,074.
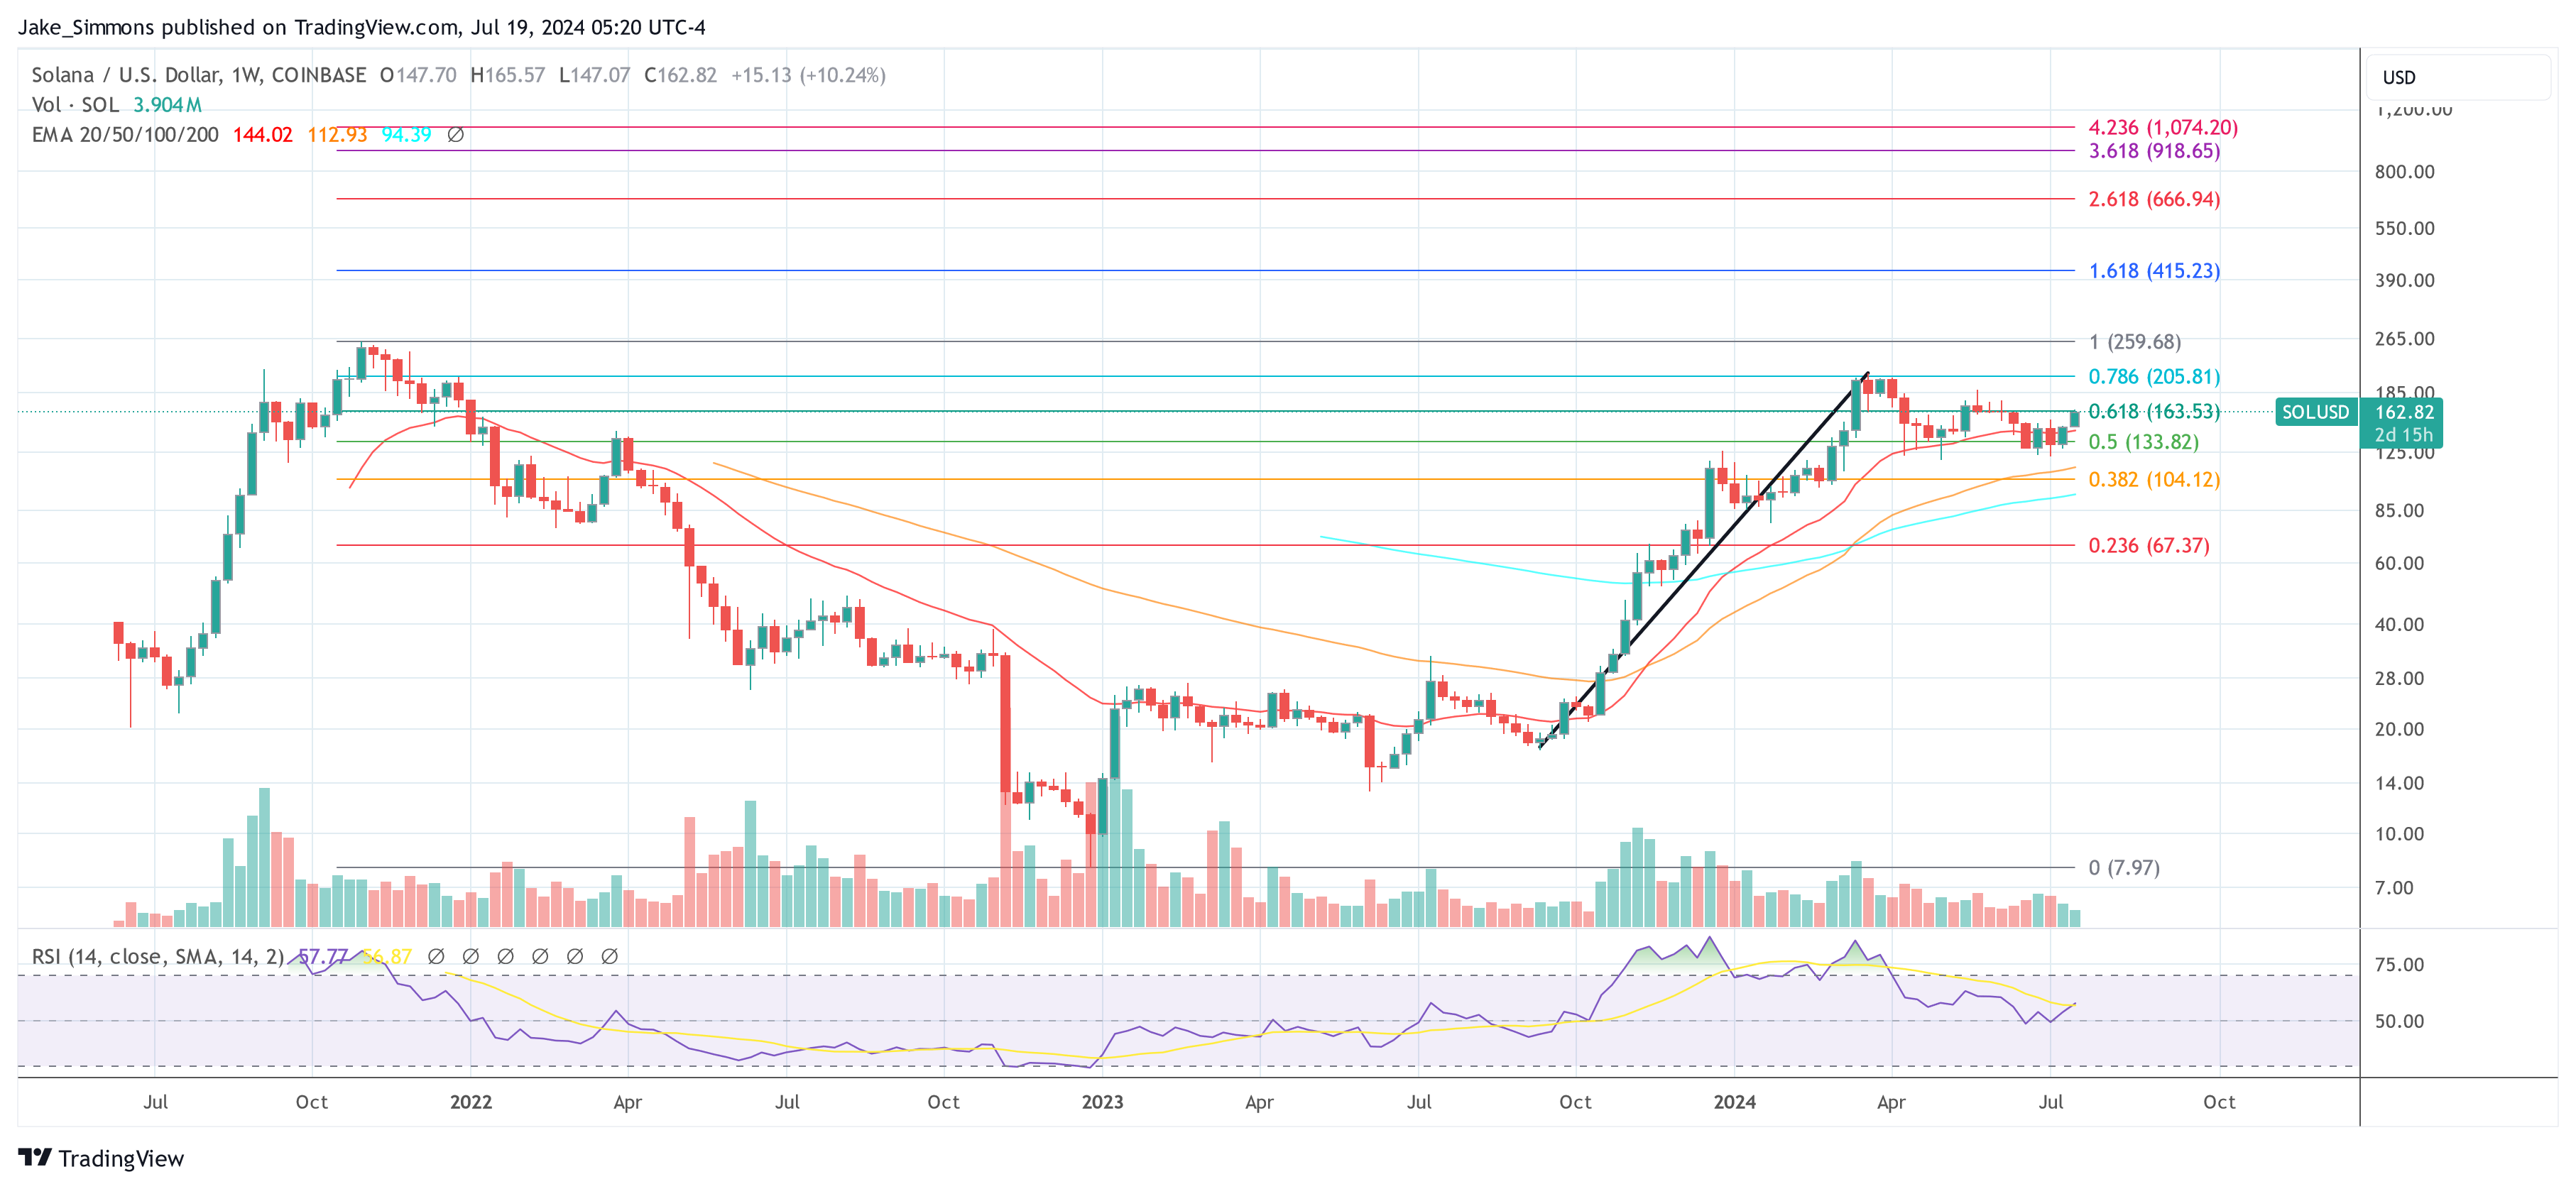
Featured image created with DALL E, chart from TradingView.com