This article is also available in Spanish.
After Monday’s decline, Ethereum (ETH) fell below key support levels and hit its lowest price since November. Nevertheless, several market observers remain positive, predicting massive cryptocurrency growth this quarter.
Ethereum falls to two-month lows
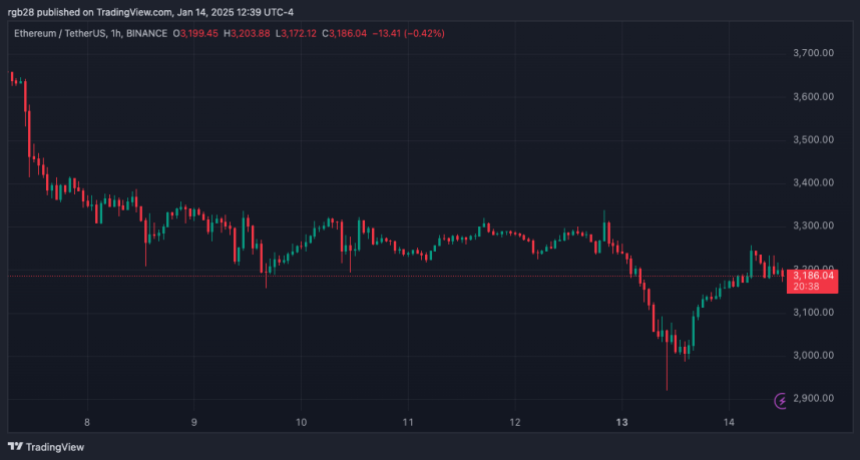
Ethereum started the week with a significant correction, falling from its weekend range to its lowest price in two months. Ethereum hovered between $3,200 and $3,340 over the weekend after rebounding from last week’s lows.
Among this appearance is cryptocurrency analyst Ali Martinez pointed found that ETH’s most critical resistance was between $3,360 and $3,450, where 4.37 million addresses bought 6.47 million ETH. The analyst also noted that the cryptocurrency’s key support was in the $3,066 to $3,160 price range, with 4.12 million addresses purchasing 4.9 million ETH.
Etherum tested this support zone during December’s corrections, bouncing from the zone after pullbacks. However, the altcoin king fell below this key support for the first time since November 9, reaching $2,920 on Monday.
After a 12% pullback from weekend highs, ETH tested its post-election breakout level, confirming the $2,900 price range as support. Ethereum quickly rebounded from this level, rising 9% to the $3,100-$3,200 range.
Cryptocurrency investor Miky Bull thinks ETH’s recent performance is “the perfect setup for a massive turnaround.” The trader noted that this could be a reversal that leads to a breakout from the inverse head and shoulders pattern on Ethereum.
The second-largest cryptocurrency by market capitalization is forming a multi-month inverse head and shoulder pattern, as noted by several analysts, with the left shoulder forming around the $2,800 price range.
Rekt Capital suggested that “any pullback near the $3,000 level could result in Ethereum developing a right shoulder.” Meanwhile, Miky Bull stated that the bullish setup was targeting the $7,000 mark.
ETH Recalls 2021 Trajectory
The Crypto Bullet analyst pointed out that the ETH chart resembles 2021 behavior. The chart shows that over three years ago, Ethereum saw a Double Top pattern during its rally. The cryptocurrency then fell below the key support zone at $3,100, confirming the pattern.
However, after two weeks of consolidation, it rebounded this level, which led to a breakout to the highest level of ETH (ATH). According to the analyst, Ethereum is repeating this pattern after yesterday’s decline, suggesting that the “worst-case scenario” cryptocurrency will reach ATH levels again.
Daan Crypto Traders highlighted ETH’s historical performance at the beginning of the year, stating that “the percentages ETH is achieving in the first few weeks of the year are pretty crazy.”
CoinGlass data can be seen that Ethereum saw mostly negative weekly returns in the first weeks of 2024, but as February approached, it began a 6-week positive streak. This may suggest that ETH’s negative performance could be reversed in the coming weeks. Nevertheless, Daan advised investors to look at quarterly returns to get a better picture of seasonality.
At the time of writing, ETH is trading at $3,230, representing a 3% escalate on the daily time frame.
Featured image from Unsplash.com, chart from TradingView.com