This article is also available in Spanish.
Solana (SOL) is trading at a critical juncture now after last week’s market rally. The token is up over 20% from recent local lows, currently testing a key supply level of around $150.
This resistance zone has caught the attention of analysts and investors, with many believing that Solana is on the verge of a rally to higher price levels. Among those who are bullish on SOL is prominent analyst Carl Runefelt, who recently shared a detailed analysis, predicting that Solana could reach fresh highs in a few days if the current momentum continues.
As the broader market continues to gain strength, traders are eagerly awaiting Solana’s next move. A successful breakout above $150 could signal a confirmed uptrend, paving the way for a potential rally. However, the coming days will be crucial for SOL as it approaches this key level, with the market closely watching to see if it reclaims the higher level or encounters renewed resistance.
Solana Bullish Pattern One Step Away from Breaking
Solana (SOL) is currently testing key supply levels that could pave the way for a significant rally toward higher prices. After days of consolidation, the altcoin looks poised to break out and confirm its daily uptrend.
Many analysts and investors are closely watching the next move. This potential shift comes as the entire cryptocurrency market has shifted from fear to optimism, spurred by the Federal Reserve’s recent decision to cut interest rates, which has breathed fresh life into the market.
Analyst Carl Runefelt, one of the leading voices in the cryptocurrency space, shared his opinion technical analysis on Xrevealing that Solana has formed a symmetrical pattern. According to Runefelt, if SOL breaks out of this pattern, it could trigger a significant move higher, with price targets around $160.
The symmetrical triangle, one of the most crucial technical formations, usually signals a mighty price move after an extended period of consolidation.
Related Reading: Cryptocurrency Analyst Predicts Dogecoin to Rise 1000% Above ATH – Price Targets Revealed
With Solana hovering near this critical level, the market is eagerly awaiting a confirmed breakout. Traders are expecting a move above $150, confirming the uptrend and likely leading to higher price levels in the coming weeks. For now, all eyes are on Solana’s ability to break through this resistance and potentially reach fresh highs.
SOL Technical Analysis: Price Levels to Watch
Solana (SOL) is currently trading at $150 after testing the 200-day moving average (MA) at $154 as resistance. This key technical level has kept the price in check, and SOL is now entering a consolidation phase. Investors are positive and the growing demand could trigger a breakout from this consolidation soon.
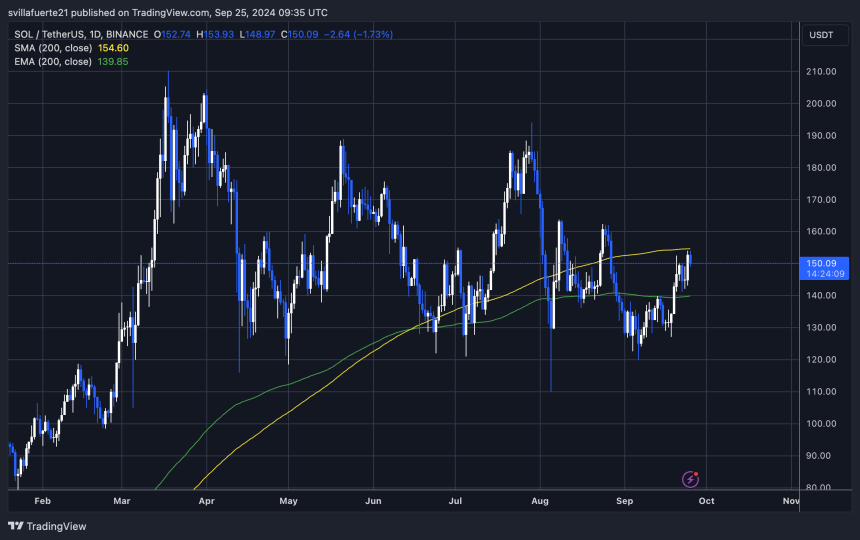
To maintain the momentum, SOL needs to reclaim the 1D 200 MA and establish fresh highs above $164. This price has acted as a key resistance; if broken, it would confirm the continuation of the daily uptrend. A successful breakout of this level could propel SOL towards even higher prices, potentially setting the stage for a run to challenge its all-time highs.
However, failure to break the daily MA 200 could signal a change in sentiment. In this case, SOL could revisit key support levels, with potential targets around $140 or even lower. This would indicate a short-term correction before another attempt to reclaim higher price levels. Traders are closely watching SOL’s next moves to determine the coin’s short-term direction.
Featured image is from Dall-E, chart is from TradingView