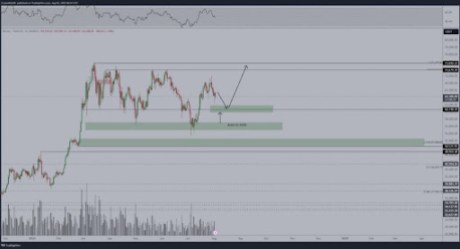
Due to market volatility and Bitcoin (BTC) price fluctuationsIt can be complex to determine the best times to buy the pioneering cryptocurrency. With that in mind, the crypto analyst has pinpointed key price levels that investors should monitor potential purchase opportunities.
Buy Levels to Watch for Bitcoin Price
A cryptocurrency analyst who goes by the name “Stockmoney Lizards” took to X (formerly Twitter) on August 1 to to discuss Recent Bitcoin price fluctuations that highlight key buy levels and the cryptocurrency’s tendency to boost in price. The analyst notes that Current Bitcoin Price Action indicate a classic 5-wave uptrend followed by an ABC correction with an overarching B wave.
The ABC correction is a continuous pattern that occurs during uptrends or downtrends. It is a pattern within Elliott Wave Theory which reflects a three-wave correction and helps identify trend continuation.
Sharing a Bitcoin price chart illustrating each wave (A, B, and C), the analyst revealed that Wave B ended at the Value Area High (VAH) at around $69,885. According to the analyst, this price level has historically acted as resistance. This means that Bitcoin price may have a tough time breaking above this point.
The analyst also revealed that the $66,745 price also acted as resistance level for bitcoinHe highlighted this critical level on the BTC price chart, emphasizing that the red line represents the Point of Control (POC) of the cryptocurrency.
What’s more, 1,618 Fibonacci Extension Level for Bitcoin is identified as a potential support area for a modern uptrend. The analyst revealed that this key level coincides with 0.5 Fibonacci Retracement Level and Value Area Low (VAL), which are critical support levels.
Concluding his analysis, the crypto analyst suggested that the support area between $61,800 and $62,300 was an critical buy level to watch out for. He noted that on higher time frames, Bitcoin’s Potential Uptrend is still intact, adding that if the cryptocurrency price falls below the $61,800 level, then a further decline should be expected to test the 2,618 Fibonacci extension at $56,800.
Generally speaking, cryptocurrency analysts lean towards bullish outlook for the short-term and medium-term time frames for Bitcoin price. At the time of writing, Bitcoin is trading at $61,594, reflecting a 4.21% decline in the past 24 hours, according to CoinMarketCap.
BTC ready for a September breakout
Other analysts also remained relatively sanguine about the price of Bitcoinpredicting rallies to modern all-time highs for the pioneering cryptocurrency. According to a crypto analyst identified as “TOBTC” on X, Bitcoin has experienced a significant decrease at a price that has dropped below $63,000.

Analyst revealed that despite Bitcoin’s rejection at $70,000 resistance, a potential breakout could be expected in September. This bullish sentiment is shared by another cryptocurrency analyst, Michael van de Poppe, who predicts that if Bitcoin stays above $60,000-61,000, the cryptocurrency could see an upward move modern all-time records in September or October 2024.
Featured image created with Dall.E, chart from Tradingview.com
